

Calculating ROI on employee safety training starts with comparing the financial savings linked to training with its total cost: divide the savings by the training costs, then multiply by 100 to express the result as a percentage. Use South African Rand (R) throughout, and base the comparison on workplace data from before and after the training.
Safety training serves a clear operational purpose, but its value can be hard to demonstrate when costs and incident outcomes are recorded separately. A fair assessment includes direct injury expenses and indirect effects such as work stoppages, lost productivity and replacement staffing, using comparable measurement periods.
This guide shows how to identify these costs, calculate ROI and compare results before and after training without treating every change as proof of impact. It also covers indicators that can help determine whether training is contributing to safer work practices and stronger operational performance.
Key Takeaways
- Include both direct injury expenses and indirect costs, such as disruption, lost productivity and replacement staffing, for a more complete view of workplace losses.
- Assess the value of safety training through changes in incidents, productivity and compliance, rather than relying on injury figures alone.
- Calculate ROI by comparing monetary savings with the full training investment, including employee time, materials and equipment.
- Use comparable pre-training and post-training periods, and consider work hours and incident trends when interpreting results.
- Use the findings to identify where targeted safety training can support better risk management and operational performance.
Direct and indirect workplace injury costs
Before assessing whether a safety programme delivers a return on investment, establish a baseline for injury costs. In a South African workplace, separate recorded expenses from operational losses, then compare equivalent periods using consistent cost categories.
-
Identify direct and indirect injury costs
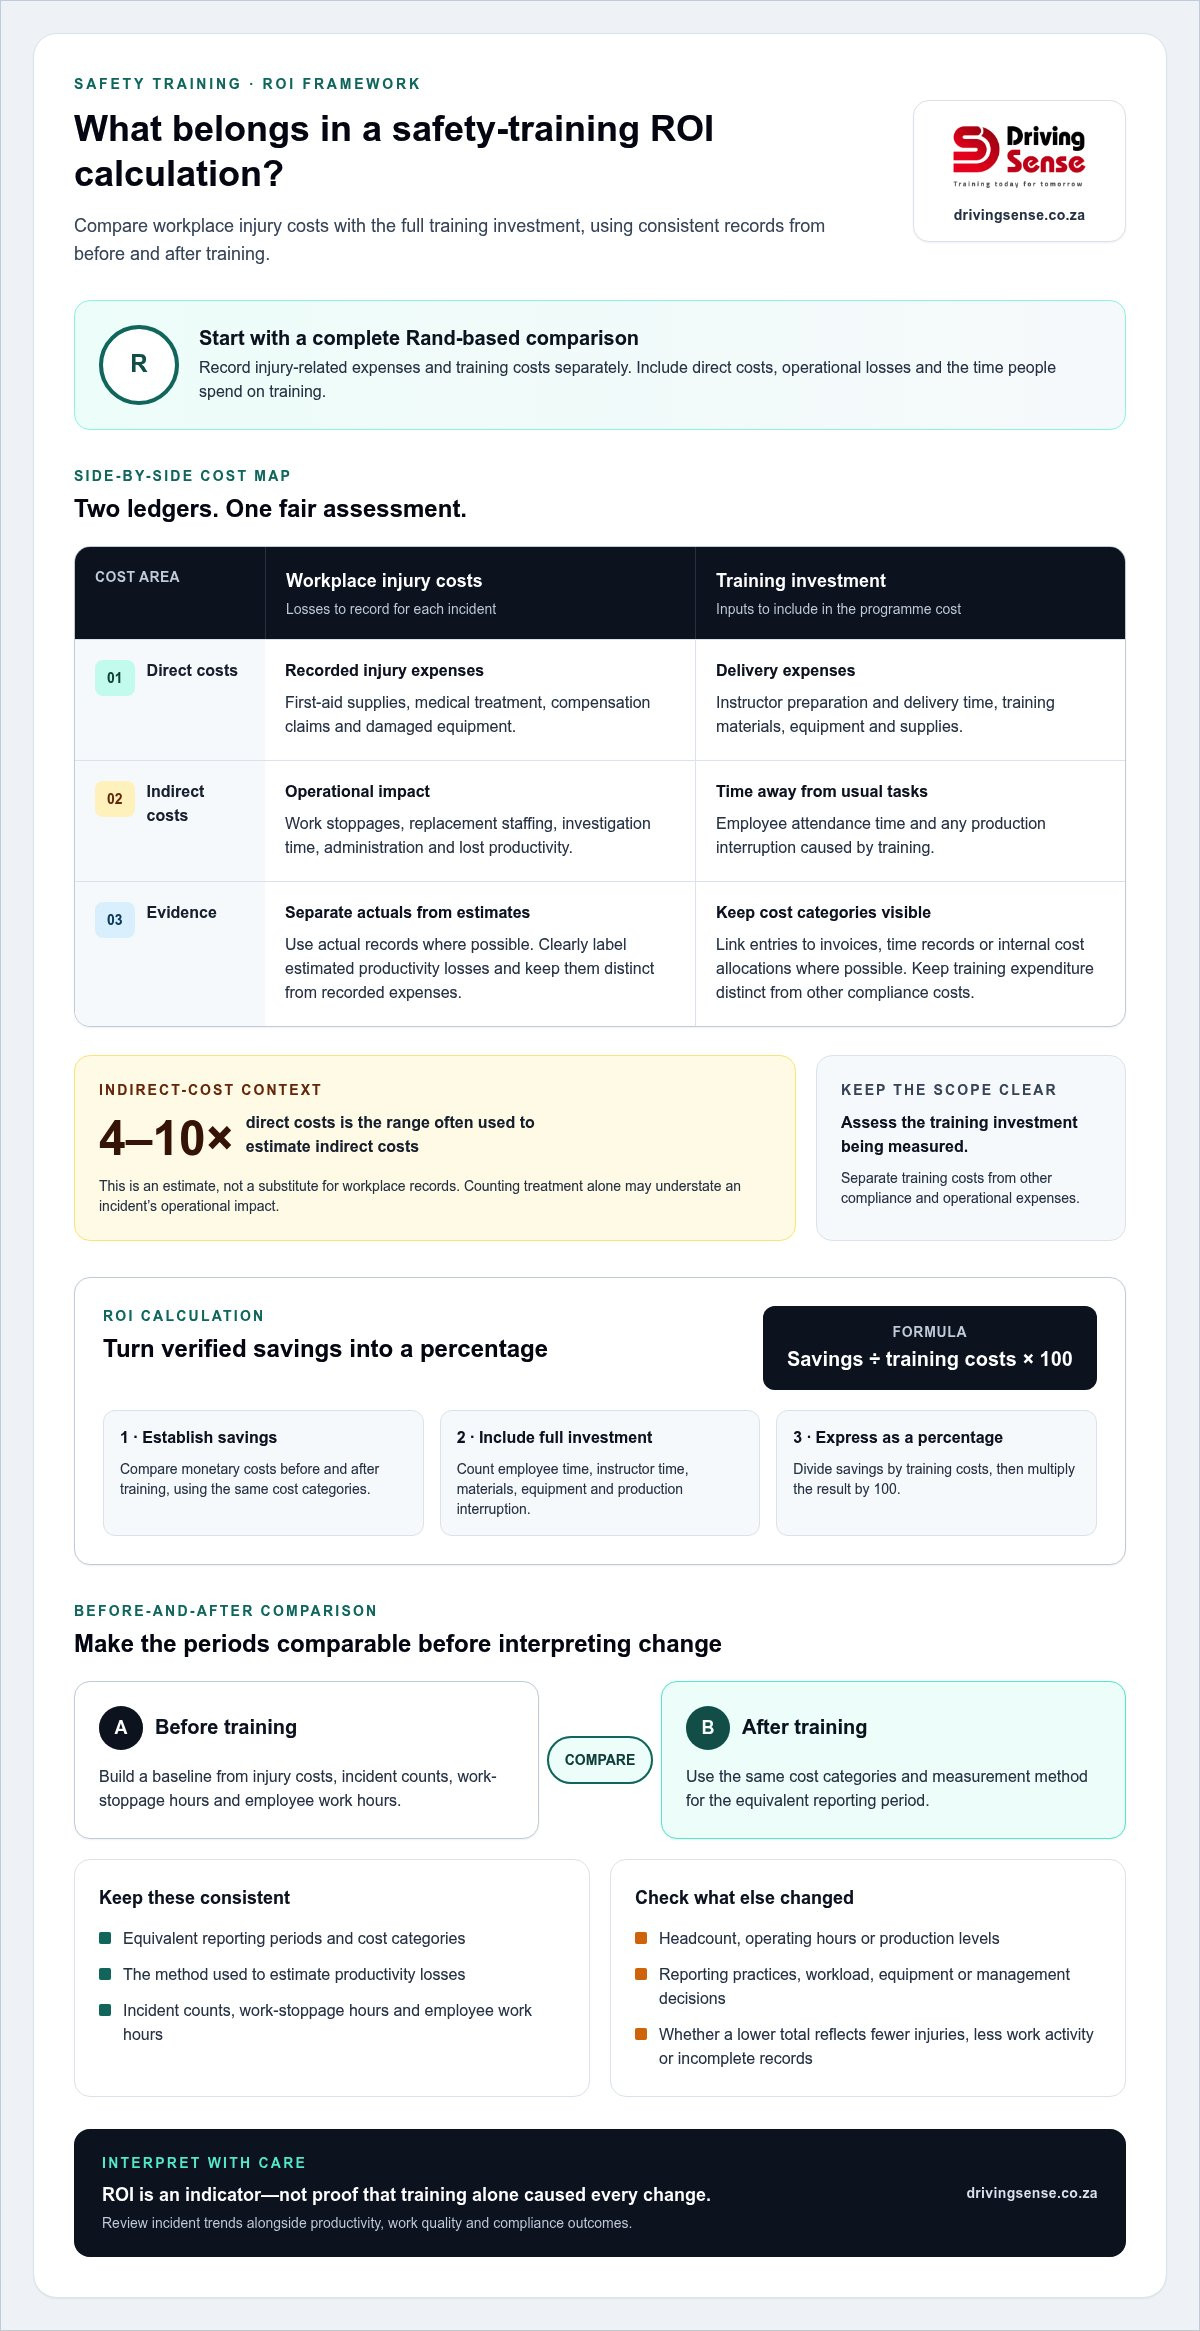
Record each injury-related expense in a ledger, with a separate entry for each incident. Direct costs may include first-aid supplies, medical treatment, compensation claims and damaged equipment. Indirect costs may include work stoppages, replacement staffing, investigation time, administration and lost productivity.
For example, record treatment costs separately from the hours colleagues spend covering an injured employee’s duties. Indirect costs are often estimated at four to ten times direct costs, so counting treatment alone may understate an incident’s operational impact. Use actual records where possible and clearly label estimates.
- Include instructor and delivery costs. Add instructor preparation and delivery time, training materials, equipment and supplies to the investment ledger. Include employee attendance time and any resulting production interruption. For a practical session, record preparation time as well as the hours employees spend away from their usual tasks.
Keep these inputs separate rather than combining them into a single training-programme total. This helps managers identify whether delivery time, materials or operational disruption accounts for the largest share. It also ensures employee time is counted even when there is no separate invoice.
- Record South African compliance-related expenses. For each workplace training activity, record the organisation’s actual delivery and administrative costs, and note the activity’s purpose. Distinguish training expenditure from other compliance costs, such as internal record-keeping or operational measures, so the calculation reflects the investment being assessed.
Use the same categories in every reporting period, linking each entry to an invoice, time record or internal cost allocation where possible. This gives managers a consistent basis for comparing safety-training expenditure across teams or sites without relying on cost estimates from another jurisdiction.
-
Compare incident costs across years
Compare direct and indirect injury costs across equivalent periods, such as one full year against the next. An average across five years can give a clearer view of typical incident costs than a single unusual year. For each period, include incident counts, work-stoppage hours, employee work hours and cost categories.
Check whether headcount, operating hours, reporting practices or production levels changed between periods. A lower total may reflect fewer injuries, less work activity or incomplete records. Keep actual expenses separate from estimated productivity losses, and apply the same method to both periods before assessing the training investment.
Why determine your return on health and safety investments?
Measure benefits through incident trends, productivity, work quality and compliance outcomes. Treat ROI as an indicator, not proof that training alone caused every change. Workload, equipment and management decisions can also affect results.
-
Identify productivity and quality improvements
Track operational measures that training could plausibly influence, such as completed work, errors, rework and delays. Compare these with incident records to see whether safer work practices coincide with improved output or quality. Liberty Mutual research reports productivity improvements of 4-8% at companies with effective safety programmes, but this benchmark is not a South African forecast.
Use your own baseline to make a relevant comparison instead of adopting an external percentage as an expected result.
-
Measure productivity and lost time
Record lost-time injuries and the working days associated with each incident. Lost Time Injury Frequency Rates track injuries or illnesses that result in lost working days, helping organisations monitor a consistent occupational safety measure over time. Pair this indicator with output data: fewer lost days alone do not prove that productivity or quality improved.
Compare equivalent reporting periods and note any changes in work hours or production volumes.
-
Estimate lost productivity
Estimate the output affected by an incident or stoppage using recorded interruption time and the relevant work activity. For example, identify which tasks paused, whether colleagues took over, and whether delayed work required later catch-up. Record direct output effects separately from estimates, so decision-makers can distinguish measured savings from assumptions.
Use the same method before and after training. Otherwise, the comparison may reflect changed accounting rather than improved performance.
-
Assess productivity savings and measurement limits
Translate verified improvements into monetary savings only when your records support the calculation. Construction Industry Institute research reports that companies with zero recordable injuries complete projects 10% faster on average; treat this as a sector benchmark, not a guaranteed local outcome. ROI has limits because incident rates, staffing, equipment and production demand can change together.
Keep assumptions visible, and avoid assigning all positive results to training alone. Organisations can use workplace safety training to address risks identified through their own performance reviews.
Estimate safety training gains from reductions in accidents and incidents, increased productivity, and improved compliance. OSHA research estimates that each dollar invested in workplace safety returns between $2 and $6 to U.S. employers.
At Alcoa, productivity per employee improved by 45% after the company prioritised employee safety under CEO O’Neill. Overall profitability improved by 14% after the company prioritised employee safety under CEO O’Neill.
ROI formula and example calculation
Use one consistent formula to compare the monetary benefits of a safety programme with its investment. In South Africa, applicable occupational health and safety laws and regulations set training duties according to workplace hazards and tasks. Record the costs of required training as part of the investment.
-
Select an employee or safety programme ROI formula
Choose the formula that matches the decision: employee training, a wider safety programme, or workplace safety measures. For net return, subtract total investment from monetary benefits, divide by that investment, then multiply by 100. Express the result as a percentage, and keep the period consistent for both benefits and costs.
ROI (%) = [(monetary benefits − investment) ÷ investment] × 100. Use the same definition of benefits throughout; otherwise, a direct-cost comparison may be mistaken for a complete workplace return.
-
Apply the formula to an example
Use fields from your own ledger for the training example, and enter every amount in Rand. Add documented savings from reduced incidents and disruption, then subtract the full training investment, including employee time, materials, equipment and delivery.
For instance, if your records show benefits of RB and an investment of RI, calculate [(RB − RI) ÷ RI] × 100. This shows the method without treating an illustrative amount as a South African market cost.
-
Calculate payback period and cost-benefit ratio
Calculate payback by dividing the initial investment by average net savings per period. If the investment and savings are annual, express the result in years. If savings vary, use the actual figures for each period rather than assuming a faster recovery.
Calculate the cost-benefit ratio by dividing total monetary benefits by total investment. A ratio above 1 means benefits exceed costs; a ratio below 1 means recorded benefits have not yet matched the investment. Keep this ratio distinct from ROI, which expresses net return as a percentage.
For South African employers, applicable workplace health and safety laws and regulations establish training obligations in relation to work and hazards. Identify the relevant duty for the organisation, then include the cost of delivering the required training in the calculation.
A separate safety training example assumes a 10% decrease in an organization’s accident rate. With implementation costs of $50,000 and estimated monetary benefits of $200,000, the example reports a 300% return on investment. These figures illustrate how a projected reduction and a monetary estimate can be presented together; they do not change the need to use the same benefit and investment definitions when making a calculation. Another example describes a health and safety program that costs $50,000 and saves $125,000. It produces a net gain of $75,000 and an ROI of 150%.
The page’s worked example uses an annual safety programme investment of $74,000 and first-year benefits of $319,300, resulting in a 331% ROI. Keeping the time period visible helps distinguish this first-year result from a calculation that uses benefits over a different period. When reviewing any of these examples, retain the stated investment and benefit figures as separate inputs, then show the resulting net gain or ROI clearly. Comparing the examples is useful only when the period and meaning of benefits are understood; the reported percentages belong to their respective assumptions and figures, rather than serving as a universal expected return.
Comparing pre-training and post-training data
Set a baseline before training, then review the same indicators afterwards. Comparable periods and consistent records help distinguish an improvement from a change in workforce size, hours or reporting.
- Define the comparison period and measures. Select a clear pre-training period and an equivalent post-training period, then record incident numbers alongside employee work hours. A monthly review can reveal short-term patterns, while an annual comparison captures longer-term changes. Keep definitions consistent, including which injuries count as recordable and how lost time is logged.
Include operational indicators relevant to the work, such as stoppages, rework or completed tasks. Workers and managers should use the same reporting process in both periods, so a change in recorded incidents does not simply reflect different reporting behaviour.
- Compare injury outcomes with exposure. Review incident totals alongside work hours, staffing levels and activity rather than interpreting raw counts alone. In one worked example, recordable injuries fell from eight to six in the first year. This comparison is useful, but the figures alone do not show whether work hours or other conditions also changed.
Document material changes in equipment, workload, supervision or procedures. If production expanded after training, for example, compare incident patterns in relation to the work performed, not just overall totals. This gives management a sounder basis for assessing the programme’s contribution to outcomes.
- Compare classroom and online delivery on equal terms. Record each format’s full expenses, including employee time, instructor or platform-related delivery, materials and operational disruption. Then compare completion, assessment results and relevant workplace outcomes for groups with similar roles and hazards.
Do not assume one format costs less or delivers better results without examining your organisation’s records. Classroom practice may suit tasks that require demonstration, while online learning may support consistent access to shared information. The right comparison depends on the learning objectives and evidence of employee understanding.
- Schedule company-wide retraining and review results. A yearly retraining cycle offers a recurring opportunity to compare performance and refresh safety knowledge. Align the review with the baseline’s incident definitions and operational measures, then assess whether workers apply procedures in practice.
Separate training expenses from changes to the bottom line, including reduced disruption or rework. An improvement after training is relevant evidence, but profit can also shift with demand, staffing and production conditions. Record these factors before attributing a change to training.
Calculating safety training ROI
Turn comparable workplace records into a transparent financial measure. A consistent method for calculating ROI on employee safety training helps decision-makers connect the investment with documented benefits while making assumptions clear.
- Define the measurement period and scope. Specify the employees, hazards and training programme being assessed, then apply that scope to both costs and benefits. Include outcomes reasonably associated with the training, such as relevant workplace injuries, interruption time or quality issues. Set the baseline and review period before calculating, so the comparison does not shift to favour a particular result.
If training addresses a specific hazard, prioritise metrics linked to it rather than combining unrelated incidents. This gives managers a more useful basis for deciding whether to continue the same intervention in that work area.
- Calculate the complete investment. Add course delivery, instructor time, materials, equipment and employee time. Include operational disruption caused by attendance where records support it. Record each expense in Rand and keep categories visible so managers can see what makes up the total.
Use one accounting method throughout. For example, count employee time consistently whether workers attend a classroom session or complete online learning. A sound investment figure reflects the resources committed, not just the amount invoiced for instruction.
- Value benefits using documented changes. Identify reductions in injury-related expenses, lost time, damaged materials, equipment disruption or rework. Convert changes into Rand only when the organisation has a defensible basis, such as recorded costs or measured lost production. Keep observed savings separate from estimated benefits.
Where incident costs fluctuate, an average across five years can help establish a clearer baseline. Apply the same cost categories and assumptions to both periods. Record changes in workforce or operating conditions alongside the result, as these can also affect workplace injuries and costs.
- Apply the ROI formula and test the interpretation. Calculate ROI (%) = [(monetary benefits − total investment) ÷ total investment] × 100. When calculating ROI on employee safety training, enter the verified Rand benefit total and investment, subtract the investment from benefits, divide by investment, then multiply by 100.
A positive percentage means recorded benefits exceeded the investment under the assumptions used; a negative result means they did not. Recalculate using conservative benefit estimates and compare the results. This sensitivity check shows whether the conclusion depends on uncertain savings or remains stable across reasonable assumptions.
For a structured next step, explore workplace safety training options that can address identified organisational risks.
Driving Sense: Emergency Safety Training
Driving Sense provides Emergency Safety Training for organisations looking to strengthen emergency preparedness through structured employee instruction. Consider this training when your workplace risk review identifies a need to improve employees’ readiness for emergency procedures, then assess outcomes against the measures in your ROI review.
When identified risks involve other areas, Driving Sense also provides Driver Training, Compliance Training and Dangerous Goods training. Choosing training that matches the work and relevant hazards keeps the investment connected to operational needs, rather than treating every course as interchangeable.
Contact Driving Sense to discuss training for your organisation’s identified needs.
Put your safety findings into practice
A useful ROI process should guide the next operational decision, not simply close an accounting period. Use the results to identify risks that need attention, capabilities employees should develop and measures to track progress in the next review. This makes calculating ROI on employee safety training part of ongoing management, not a one-off exercise.
Driving Sense provides Emergency Safety Training, Driver Training and Compliance Training for organisations aligning instruction with identified workplace needs. Use your assessment to decide which area to prioritise and which outcomes to monitor, then evaluate results against your organisation’s operational records.
Take the next step by sharing your training priorities with Driving Sense. Contact Driving Sense to discuss safety training and identify an appropriate direction for your organisation.
Frequently Asked Questions
How do you calculate ROI for employee safety training?
Subtract the training investment from the monetary benefits, divide by the investment, then multiply by 100. For example, use documented Rand savings from fewer disruptions or injury-related expenses, rather than counting every operational improvement automatically. Keep the same time period for benefits and costs. A positive result indicates that recorded benefits exceeded the investment under the assumptions used; it does not, by itself, prove training caused every change.
What costs should be included when calculating safety training ROI?
Include costs directly required to plan, deliver and complete the training, then check for less visible internal expenses. These may include employees’ time away from normal duties, supervisor coordination, learning materials, equipment, assessment activities and cover for essential tasks. Use invoices and time records where possible, and avoid counting the same expense twice. Consistent categories make courses and reporting periods easier to compare.
Which safety training metrics should employers track before and after training?
Track injury and lost-time records alongside work hours, near-miss reports, assessment results and observed work practices. Near-miss reporting can help assess safety culture and reporting mechanisms, so interpret changes in reports in light of reporting behaviour. For example, improved reporting may reveal previously overlooked hazards. Add task-specific measures, such as errors or rework, when they relate directly to the training objectives.
How can employers compare safety training methods by cost and effectiveness?
Compare methods using the same learning objectives, employee groups and assessment criteria. Calculate the full cost per participant who completes the course, then assess knowledge, practical performance and subsequent workplace indicators. For example, compare online instruction with classroom or on-the-job activities for the same hazard, noting which skills require demonstration or supervised practice. A blended approach can pair consistent learning materials with practical application when the task requires it.
